DATA SCIENTIST | DATA ANALYST
Welcome! I’m Dan.
I am an Engineering—Data Science graduate student at UC Riverside. My thesis examines short and medium term energy forecasting in California utilizing various deep learning neural network architectures.
I completed my B.S. in Physics at CSU Stanislaus in 2022. I received a Data Science diploma from an intensive and comprehensive program at BrainStation. This past summer, I had the pleasure of collaborating on a project reconstructing electro-anatomical maps of the heart and leading a team of undergraduate students at the Lawrence Livermore National Laboratory.
Please let me know if you have any further questions or comments at oconnord6@gmail.com
Projects
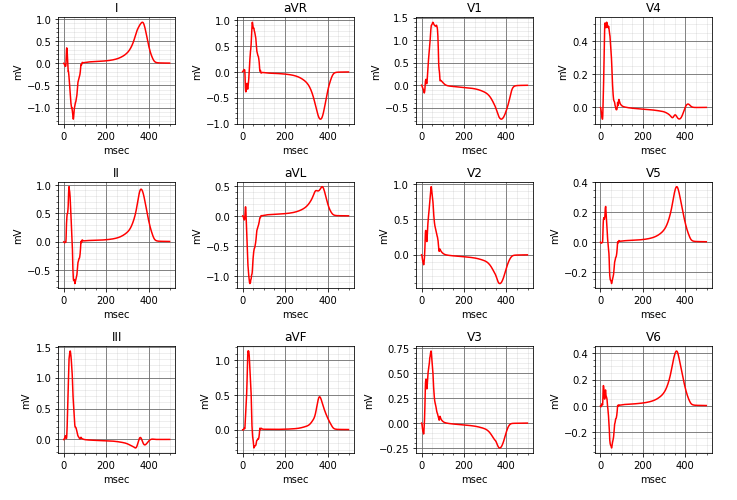
ECGs and Machine Learning in Diagnosing Heart Conditions
Summary: This project harnesses the power of machine learning to decode and analyze ECG signals, aiming to reduce human error in diagnosis. Through signal reconstruction and classification, the system not only interprets ECG signals but also identifies trans-voltage potential discrepancies. Ultimately, the goal is to provide a robust tool that can detect cardiovascular irregularities with higher precision, potentially saving countless lives.
Key skills used:
- Languages used: Python
- Libraries used: Scikit-Learn, NumPy, Pandas, PyTorch, Seaborn, Matplotlib
- Feature Engineering: Oversampling of minority classes, ECG sequence extraction for transformer models
- Classification Algorithms: K-Nearest Neighbors (KNN), Decision Tree Model, Extreme Gradient Boosting (XGBoost)
- Signal Transformation and Reconstruction: Transformer models with attention mechanisms
- Model Evaluation: Recall scores, Mean Squared Error (MSE), Accuracy metrics
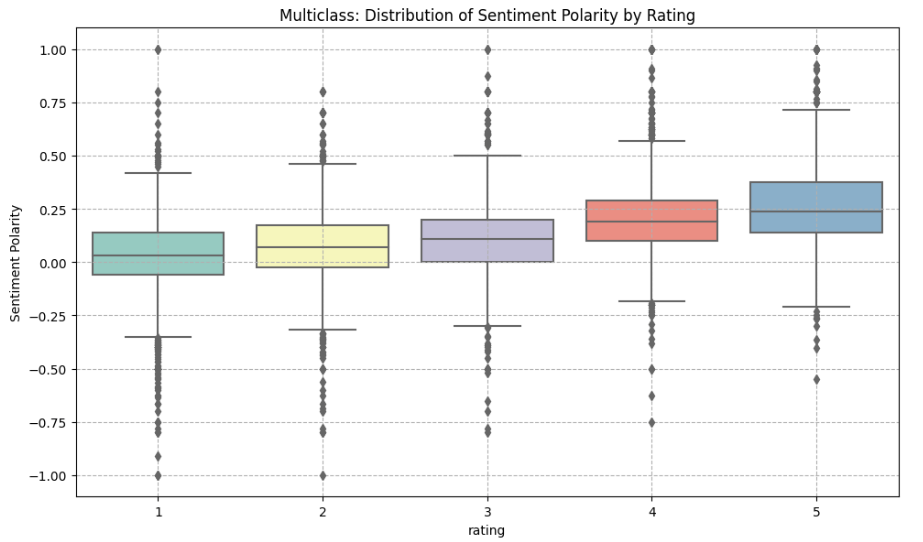
Sentiment Analysis and Rating Classification of Amazon Reviews
Summary: This project aimed to utilize machine learning techniques to automatically categorize Amazon product reviews based on their content into specific star ratings. Additionally, reviews were broadly classified into either positive or negative sentiment categories. The overarching goal was not only to understand user sentiment but also to offer a tool that can identify inconsistencies in reviews, flag potential errors, and unearth insights that can aid sellers in enhancing their product offerings and customer service.
Key skills used:
- Languages used: Python
- Libraries used: Textblob, Sci-kit Learn, Gensim, Matplotlib, Pandas, Seaborn
- Exploratory Data Analysis (EDA): Data Cleaning/Pre-processing, Sentiment Score Distribution, Count Vectorization of Reviews
- Feature Engineering: Tokenization, Lemmatization, TF-IDF Vectorization
- Classification Algorithms: K-Nearest Neighbors (KNN), Random Forest, Logistic Regression, Gradient Boosting Classifier, Naïve Bayes, Multilayer Perceptron (MLP)
- Model Evaluation: Accuracy, Confusion Matrix
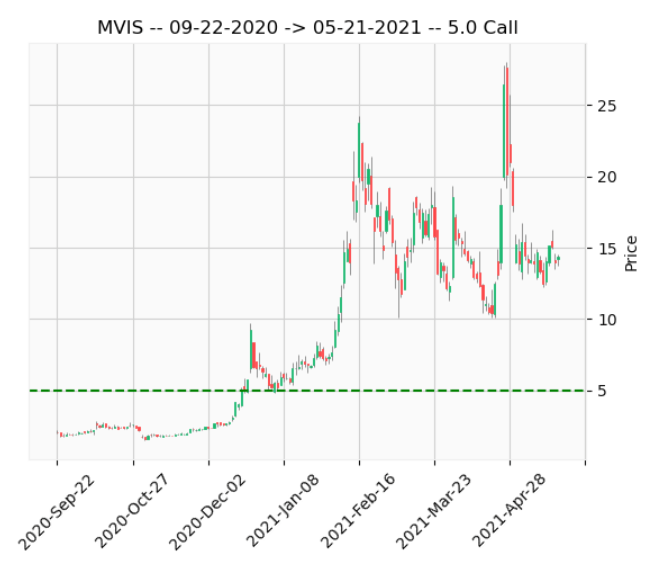
Investigation of Personal Option Trades
Summary: By importing and analyzing three years of personal Robinhood option data, I undertook an extensive data cleaning and preprocessing phase to render the data workable. This robust dataset was then enhanced by incorporating market data, which allowed for effective visualization of trades and strike prices. The primary objective was more exploratory, seeking to ascertain key determinants that drive the success or failure of a trade.
Key skills used:
- Languages used: Python
- Libraries used: Matplotlib, Seaborn, Numpy, Pandas
- Data Analysis Techniques: Data Cleaning/Pre-processing, Data Visualization, Incorporating External Market Data, Strike Price Analysis
- Exploratory Data Analysis (EDA): Examining Trade Outcomes, Identifying Successful Trade Characteristics, Uncovering Patterns in Unsuccessful Trades Outcome Measures: Factors Influencing Trade Success, Visualization of Strike Prices, Trade Trends Over Time
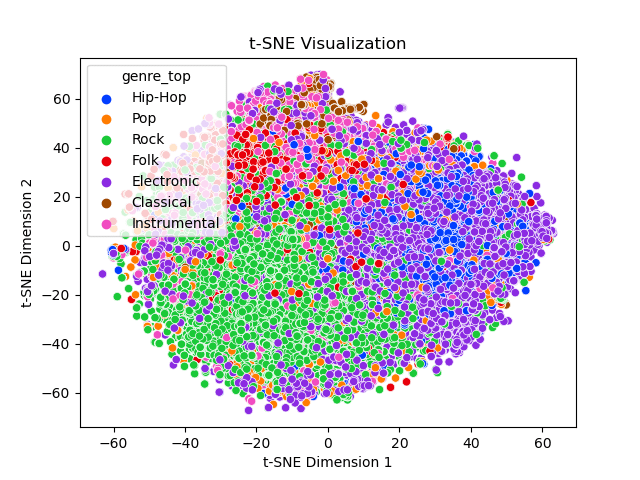
Identifying Music Genres Using Various Machine Learning Classification Algorithms
Summary: By analyzing acoustic properties (500 individual characteristics for each sample) extracted from half-minute snippets of over 100,000 tracks sourced from the Free Music Archive, I experimented with several machine-learning classifiers to predict the corresponding music genre. The dataset was notably imbalanced, therefore, to rectify this, I employed the Synthetic Minority Oversampling Technique (SMOTE) to rebalance the data for the best-performing model, which was a neural network. After applying these techniques, the model exhibited a weighted F-1 score of 0.65 across 9 unique genres.
Key skills used:
- Languages used: Python
- Libraries used: Scikit-Learn, NumPy, Pandas, TensorFlow, Seaborn, Librosa, Matplotlib
- Classification Algorithms: Logistic Regression, Neural Network, K-Nearest Neighbor (KNN), Random Forest, and Decision Tree
- Exploratory Data Analysis (EDA): Identify Anomalies, Model Feature Distributions, Data Cleaning/Pre-processing
- Feature Engineering: Scaling, Encoded Variables, t-Distributed Stochastic Neighbor Embedding (t-SNE)
- Model Evaluation: Precision, Recall, F-1 Score, Confusion Matrix
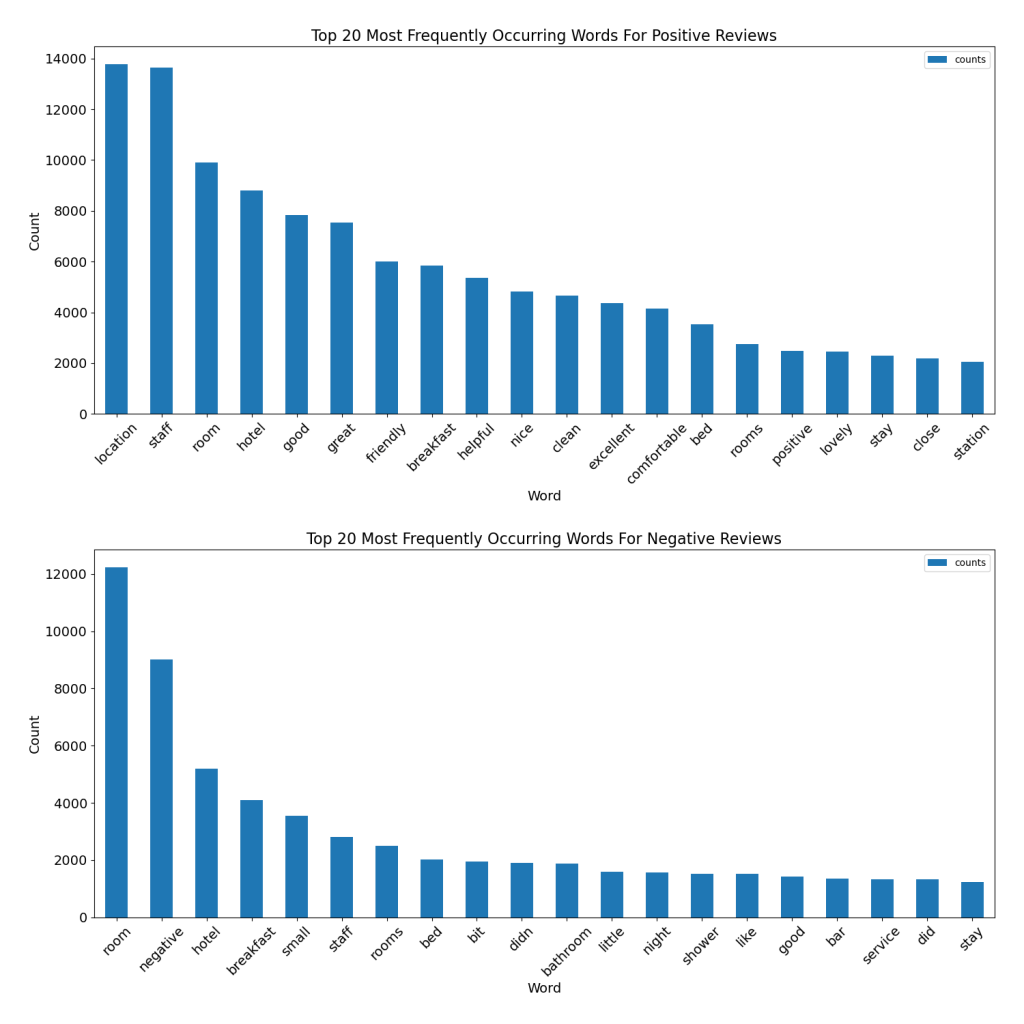
Predicting Hotel Review Sentiment Using NLP
Summary: Constructed a binary sentiment analysis model (positive or negative sentiment) for hotel reviews. Utilized natural language processing techniques to extract key features and vectorize the words using TF-IDF from a sizable dataset of reviews. Employed machine learning algorithms including logistic regression, KNN, and random forest for sentiment classification. The final model not only effectively classified review sentiments, but also provided interpretable results, enabling clear understanding of positive and negative driving factors in the reviews.
Key skills used:
- Languages used: Python
- Libraries used: Scikit-Learn, NumPy, Pandas, Seaborn, Matplotlib,
- Classification Algorithms: Logistic Regression K-Nearest Neighbor (KNN), Random Forest
- EDA: Identify Anomalies, Model Feature Distributions, Data Cleaning/Pre-processing
- Feature Engineering: Scaling, Encoded Variables
- Model Evaluation: Accuracy, Confusion Matrix
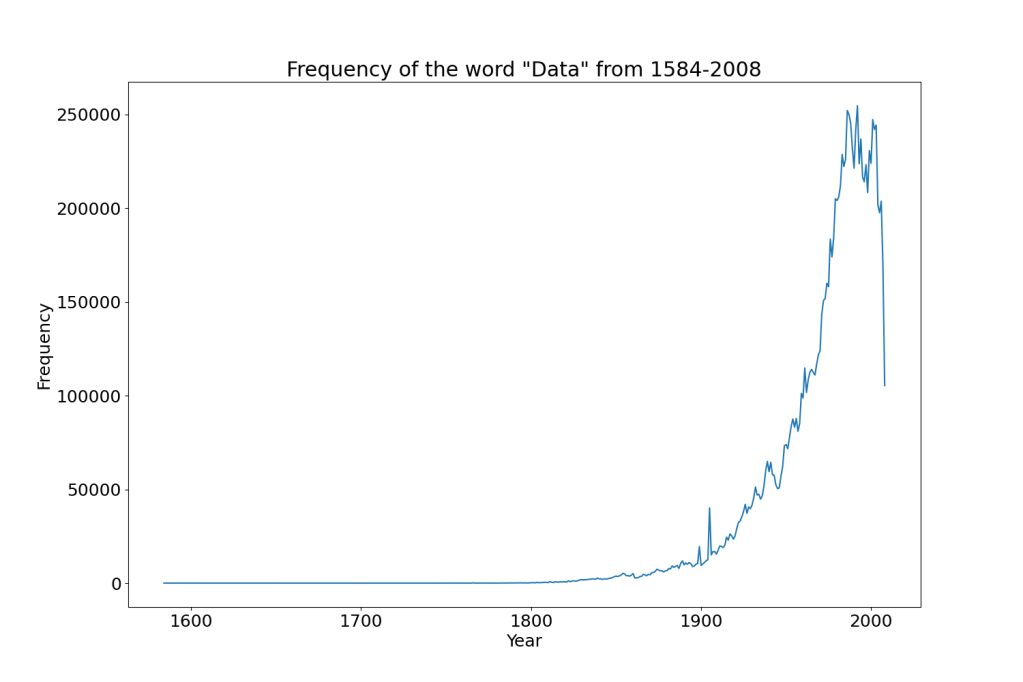
Big Data Analysis using Google N-Grams Dataset
Summary: Implemented a comprehensive Big Data analysis workflow on the Google Ngrams dataset, which consists of leveraging tools like Hadoop, Spark, Hive, and the S3 filesystem on a cloud-based distributed computing environment. Created an Amazon EMR cluster, imported the dataset into the Hadoop File System (HDFS), and conducted data processing and analysis using PySpark. Filtered data for specific tokens, wrote results back to HDFS, and exported the final dataset to a personal S3 bucket. Performed local data visualization. This work resulted in a robust Big Data analysis pipeline capable of handling substantial datasets with interpretability and efficiency.
Key skills used:
- Languages/Software used: Python, Hadoop, Spark, Hive, AWS S3, EMR
- Libraries used: PySpark, Pandas, Matplotlib, s3fs (for AWS S3 interactions)
- Exploratory Data Analysis (EDA): Filter/Query Large Dataset
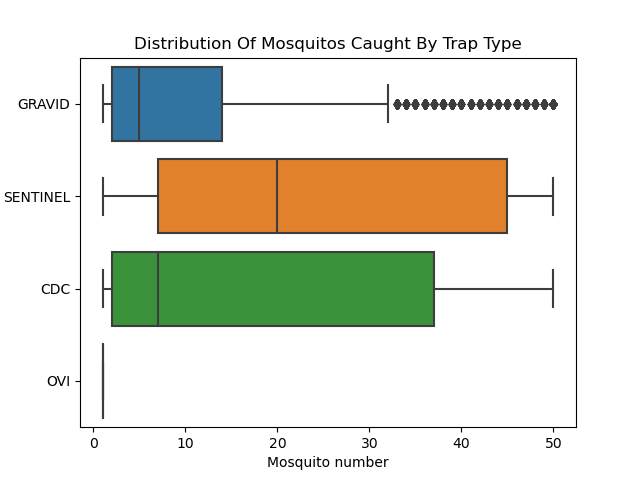
Predictive Analysis and Modeling of West Nile Virus Spread in Chicago
Summary: Analyzed a comprehensive mosquito tracking dataset from the city of Chicago to understand West Nile Virus spread patterns. Executed data cleaning, exploratory data analysis, and statistical tests to derive insightful correlations. Constructed a linear regression model to predict mosquito population and a logistic regression model to anticipate virus presence. These models provided meaningful insights into factors influencing mosquito population and virus prevalence.
Key skills used:
- Languages used: Python
- Libraries used: Numpy, Matplotlib, Pandas, Seaborn, Scipy Stats
- EDA: Model Feature Distributions, Data Cleaning/Pre-processing
- Feature Engineering: Eliminating Colinearity, Encoding Time Variables
- Classification Algorithms: Linear Regression, Logistic Regression
- Model Evaluation: R^2, Residuals, Coefficient Interpretation, Odds ratio
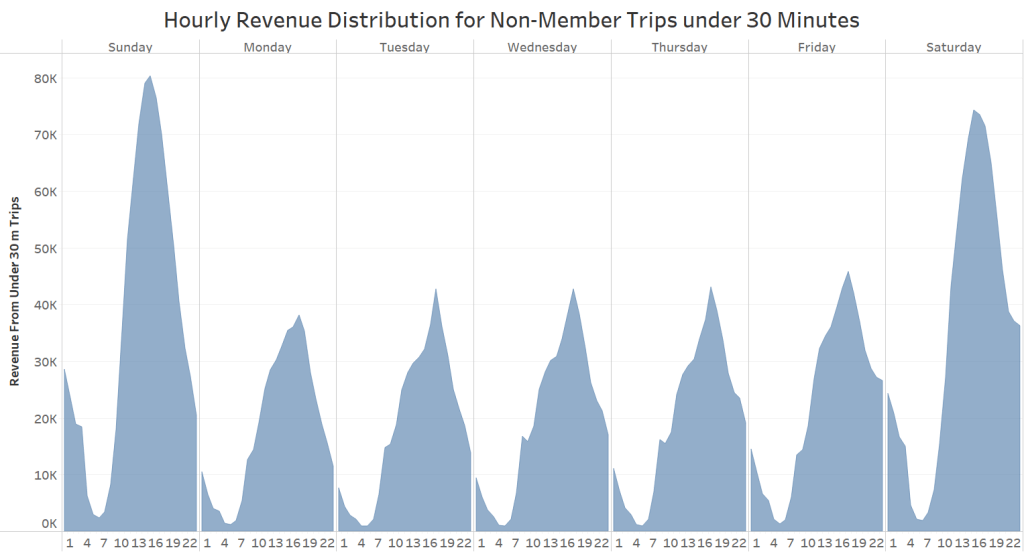
Bixi Bike Analysis: Uncovering Usage Patterns and Revenue Insights
Summary: Performed an extensive SQL-based data analysis on the large (>10mm) Bixi (Canadian rentable bike company) dataset to derive a comprehensive understanding of Bixi bike usage, influential factors of volume, popular stations, and business growth. I manipulated and interpreted this dataset using advanced SQL queries to generate key insights and recommendations on volume and membership status, peak demand times, station popularity, station usage, and round trip percentage at stations. I created data visualizations in Tableau to contrast and compare the data in various ways. I designed a pricing model and computed the generated revenue for different trip lengths. Finally, I developed an interactive dashboard to allow the operations team to easily drill into the data as required.
Key skills used:
- Languages used: SQL
- Data Visualization Tools: Tableau
- Business Analysis: Critical evaluation and interpretation of data trends to provide actionable insights.
- Data Management: Efficient handling of large datasets in a SQL environment.
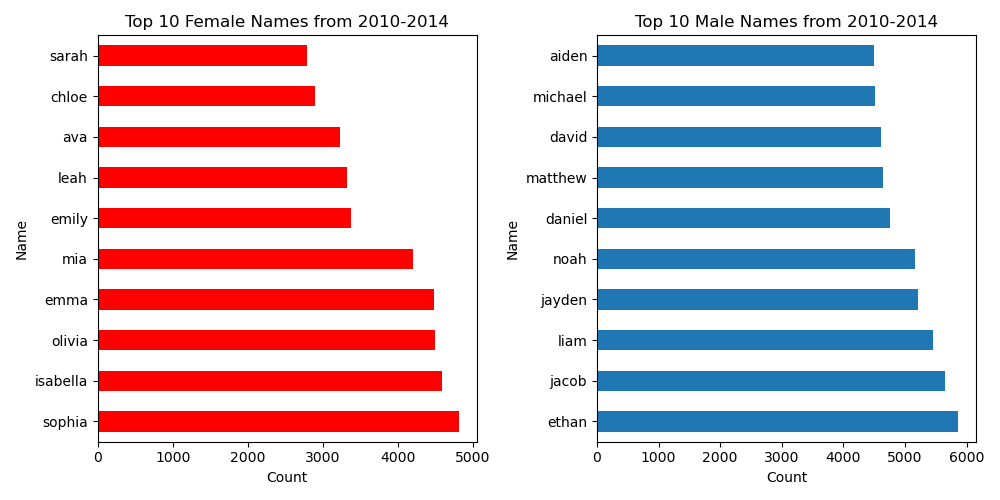
Baby Name Exploration and Analysis
Summary: Delved into a vast dataset encompassing baby names spanning from 2010 to 2014, covering four distinct ethnicities and both male and female categories. Conducted in-depth exploratory data analysis to unearth trends, relationships, and patterns among the variables. Visualized the data to capture the essence of naming variations and popularities across different demographics.
Key skills used:
- Languages used: Python
- Libraries used: Matplotlib, Pandas, Seaborn
- EDA: Distribution Analysis, Variable Relationship Exploration, Trend Identification
- Data Visualization: Name Popularity Over Time, Ethnicity-based Name Distribution, Gender-wise Name Patterns
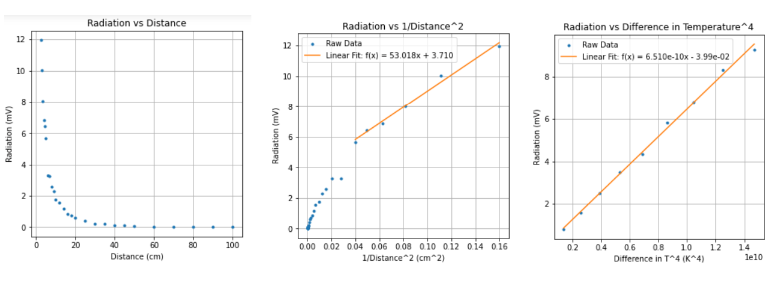
Thermal Radiation: Investigating Emissivity and Intensity of a Leslie Cube and Intensity Emitted from a Boltzmann Lamp
Summary: The characteristics of thermal radiation were examined using a Boltzmann lamp, Leslie cube, and radiation sensor. The experiments assessed emissivity of various coatings, the relationship between radiation intensity and distance, and verified the Stefan-Boltzmann power law at low temperatures. Findings confirmed that radiation intensity adheres to the inverse square law beyond 10 cm, and at low temperatures, intensity is proportional to temperature raised to the fourth power.
Key skills used:
- Languages used: Python
- Libraries used: Matplotlib, Numpy, Scipy
- Data Analysis Techniques: Linear regression analysis using SciPy’s curve fit function, error estimation from covariance matrices, and graphical visualization of relationships with Matplotlib.
Nuclear Physics: Gamma Spectroscopy
Summary: Using an Analog to Digital Multi-Channel Analyzer (ADMCA) and its software, gamma rays were detected with a Sodium Iodide (NaI) scintillator coupled with a photomultiplier. After collecting the data, It was processed using MCA software, converting it into a histogram. I calibrated the histogram channels into energy units, referencing Na-22. To delve deeper, I exported the data and processed it in Python, fitting Gaussian functions to identify peak energies, uncertainties, and other characteristics.
Key skills used:
- Languages used: Python
- Libraries used: Matplotlib, Numpy, Scipy
- Data Analysis Techniques: Calibrating histogram channels into energy units using Na-22 as the reference, fitting Gaussian functions to raw data for peak identification, calculating uncertainties in energy levels from the Gaussian fit, comparing experimental energy levels to known values, identifying Compton edge data and determining peak values from graphs.
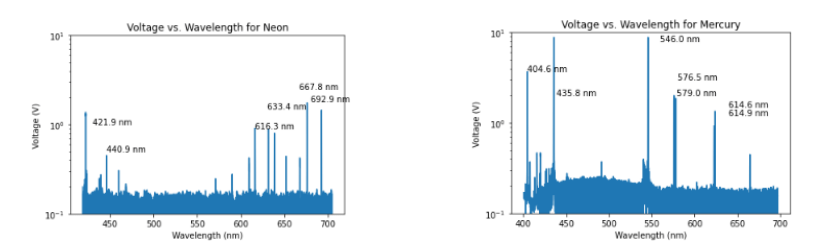
Light Spectroscopy: Measuring Intensity at Various Wavelengths
Summary: Using a spectrometer, the spectral emissions of elements like hydrogen, helium, mercury, and neon were captured and analyzed. These gaseous elements, stored in a Geissler tube, were excited via voltage to induce photon emissions within the range of 400nm to 700nm. Through Python, the collected data was processed and compared to the known emission values from the NIST database, allowing for a detailed analysis of the observed emissions.
Key skills used:
- Languages used: Python
- Libraries used: Matplotlib, Numpy
- Data Analysis Techniques: Conversion of time readings to wavelengths, weighted averages, computation of RMSD and percent differences.